Explore 1,500+ metrics across on-chain, derivatives, sentiment and macro. Analyze cost basis, holder behavior, leverage and liquidity with established indicators and Alphractal-developed models.
Follow the question from network activity to valuation, holder behavior, derivatives positioning and macro conditions. Each family brings a different part of the market into view.
On-chain activity
Measure activity on the blockchain rather than inferring it from price alone. Track participation and transaction throughput to compare network usage with market performance.
Active addresses
Price
Illustrative
Active Addresses
Unique addresses that sent or received transactions during the interval.
Transaction Count
The number of transactions recorded during the interval.
Transactions per Second
Transaction throughput expressed as an average rate.
Mining on proof-of-work networks: Mean Hash Rate tracks computational work, while Puell Multiple compares daily issuance value with its 365-day average.
Use case Compare a price move with changes in network participation and transaction activity.
Valuation
Compare market pricing with on-chain cost-basis measures. Distinguish the price investors see from the prices at which supply last moved.
MVRV
Market capitalization divided by realized capitalization.
Realized Price
An on-chain cost-basis reference derived from the prices at which coins last moved.
MVRV Z-score
The difference between market and realized capitalization, divided by the standard deviation of market capitalization.
Use case Compare current valuation with cost basis and previous valuation regimes.
Holder behavior & supply
Examine how supply is distributed across holder cohorts and profit or loss conditions. Separate the behavior of older supply from that of recent market entrants.
Long-Term Holders Supply
Supply held in coins that have not moved for more than 155 days.
Supply in Profit
Supply whose last-moved price is below the current price.
Supply in Loss
Supply whose last-moved price is above the current price.
Use case Track changes in holder composition and the amount of supply under unrealized profit or loss.
Realized profit & loss
Study spending behavior on UTXO-based chains. Realized profit and loss measures complement the picture of unrealized gains and losses.
SOPR
The ratio between a coin’s value when spent and when received, aggregated across spent outputs. Above 1 indicates aggregate realized profit; below 1 indicates aggregate realized loss.
Short-Term Holder SOPR
The same spending-profit framework applied to short-term holders.
Long-Term Holder SOPR
The same framework applied to long-term holders.
Use case Compare whether recent entrants and longer-term holders are realizing profits or losses during the same market move.
Exchange flows
Track on-chain movements into and out of identified exchange entities. Compare deposits, withdrawals and net flows in native units or USD.
Exchange Inflows
Transfers into tracked exchange entities.
Exchange Outflows
Transfers out of tracked exchange entities.
Exchange Netflow
Inflows minus outflows. Positive values indicate net deposits; negative values indicate net withdrawals.
Use case Compare changes in exchange-bound supply with price, holder behavior and derivatives activity.
Derivatives & positioning
Analyze the cost of leverage, outstanding contract exposure and differences in trader positioning. Keep perpetual-market activity separate from spot ownership.
Funding Rate
The periodic payment rate between long and short perpetual positions.
Open Interest
Outstanding futures and perpetual exposure, available in coin units or USD depending on the series. Each contract is counted once rather than adding its long and short sides.
Whale vs Retail Delta
The difference in leveraged positioning between large and small traders.
Whale vs Retail Ratio
A relative positioning ratio with parity at 1, rather than 0.
Use case Compare price and open interest with funding and trader positioning to examine leverage conditions.
Liquidations
Distinguish liquidation events from liquidation-level analysis. Read forced-position closures separately from the distribution of levels shown in liquidation maps.
Liquidations
Recorded forced closures of leveraged derivatives positions.
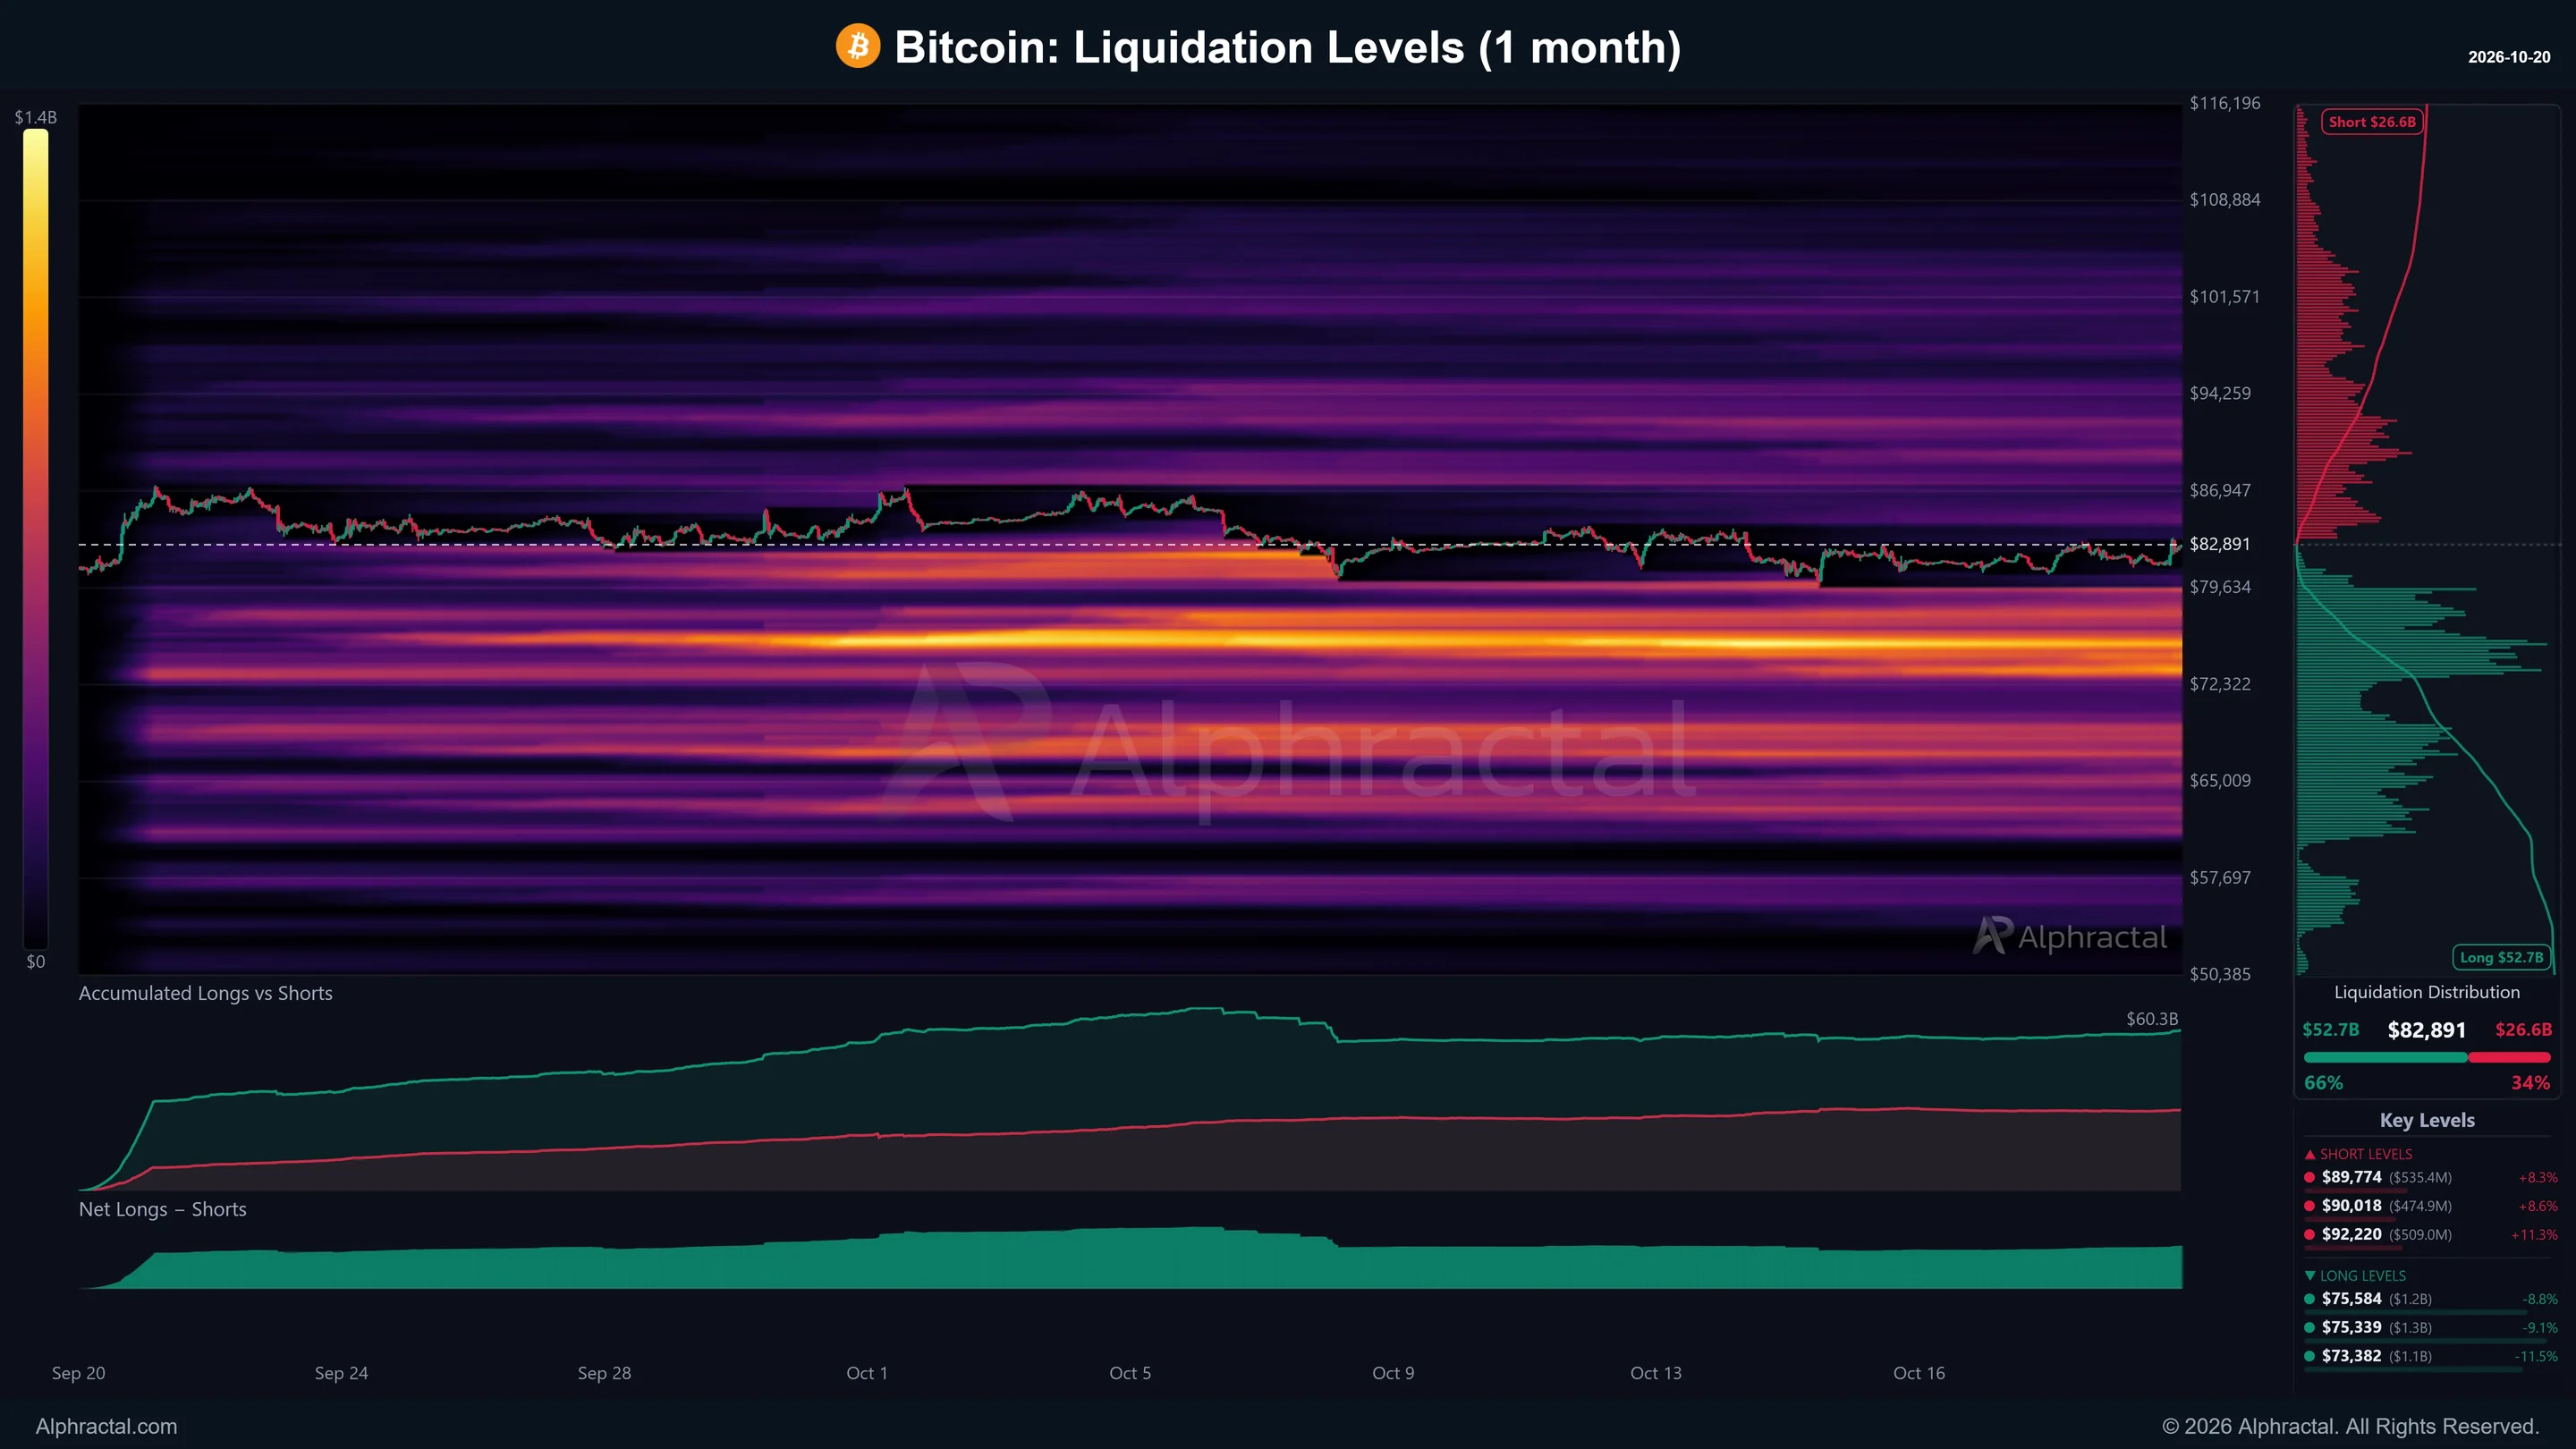
Liquidation Heatmap
A price-by-time map of estimated liquidation-level concentrations.
Liquidation Zones
Grouped price zones of estimated liquidation exposure.
Use case Compare where liquidations have occurred with the concentrations shown in the level map.
Cycle & market structure
Add cycle context and structural price zones to conventional market indicators. Compare slower market regimes with more responsive momentum measures.
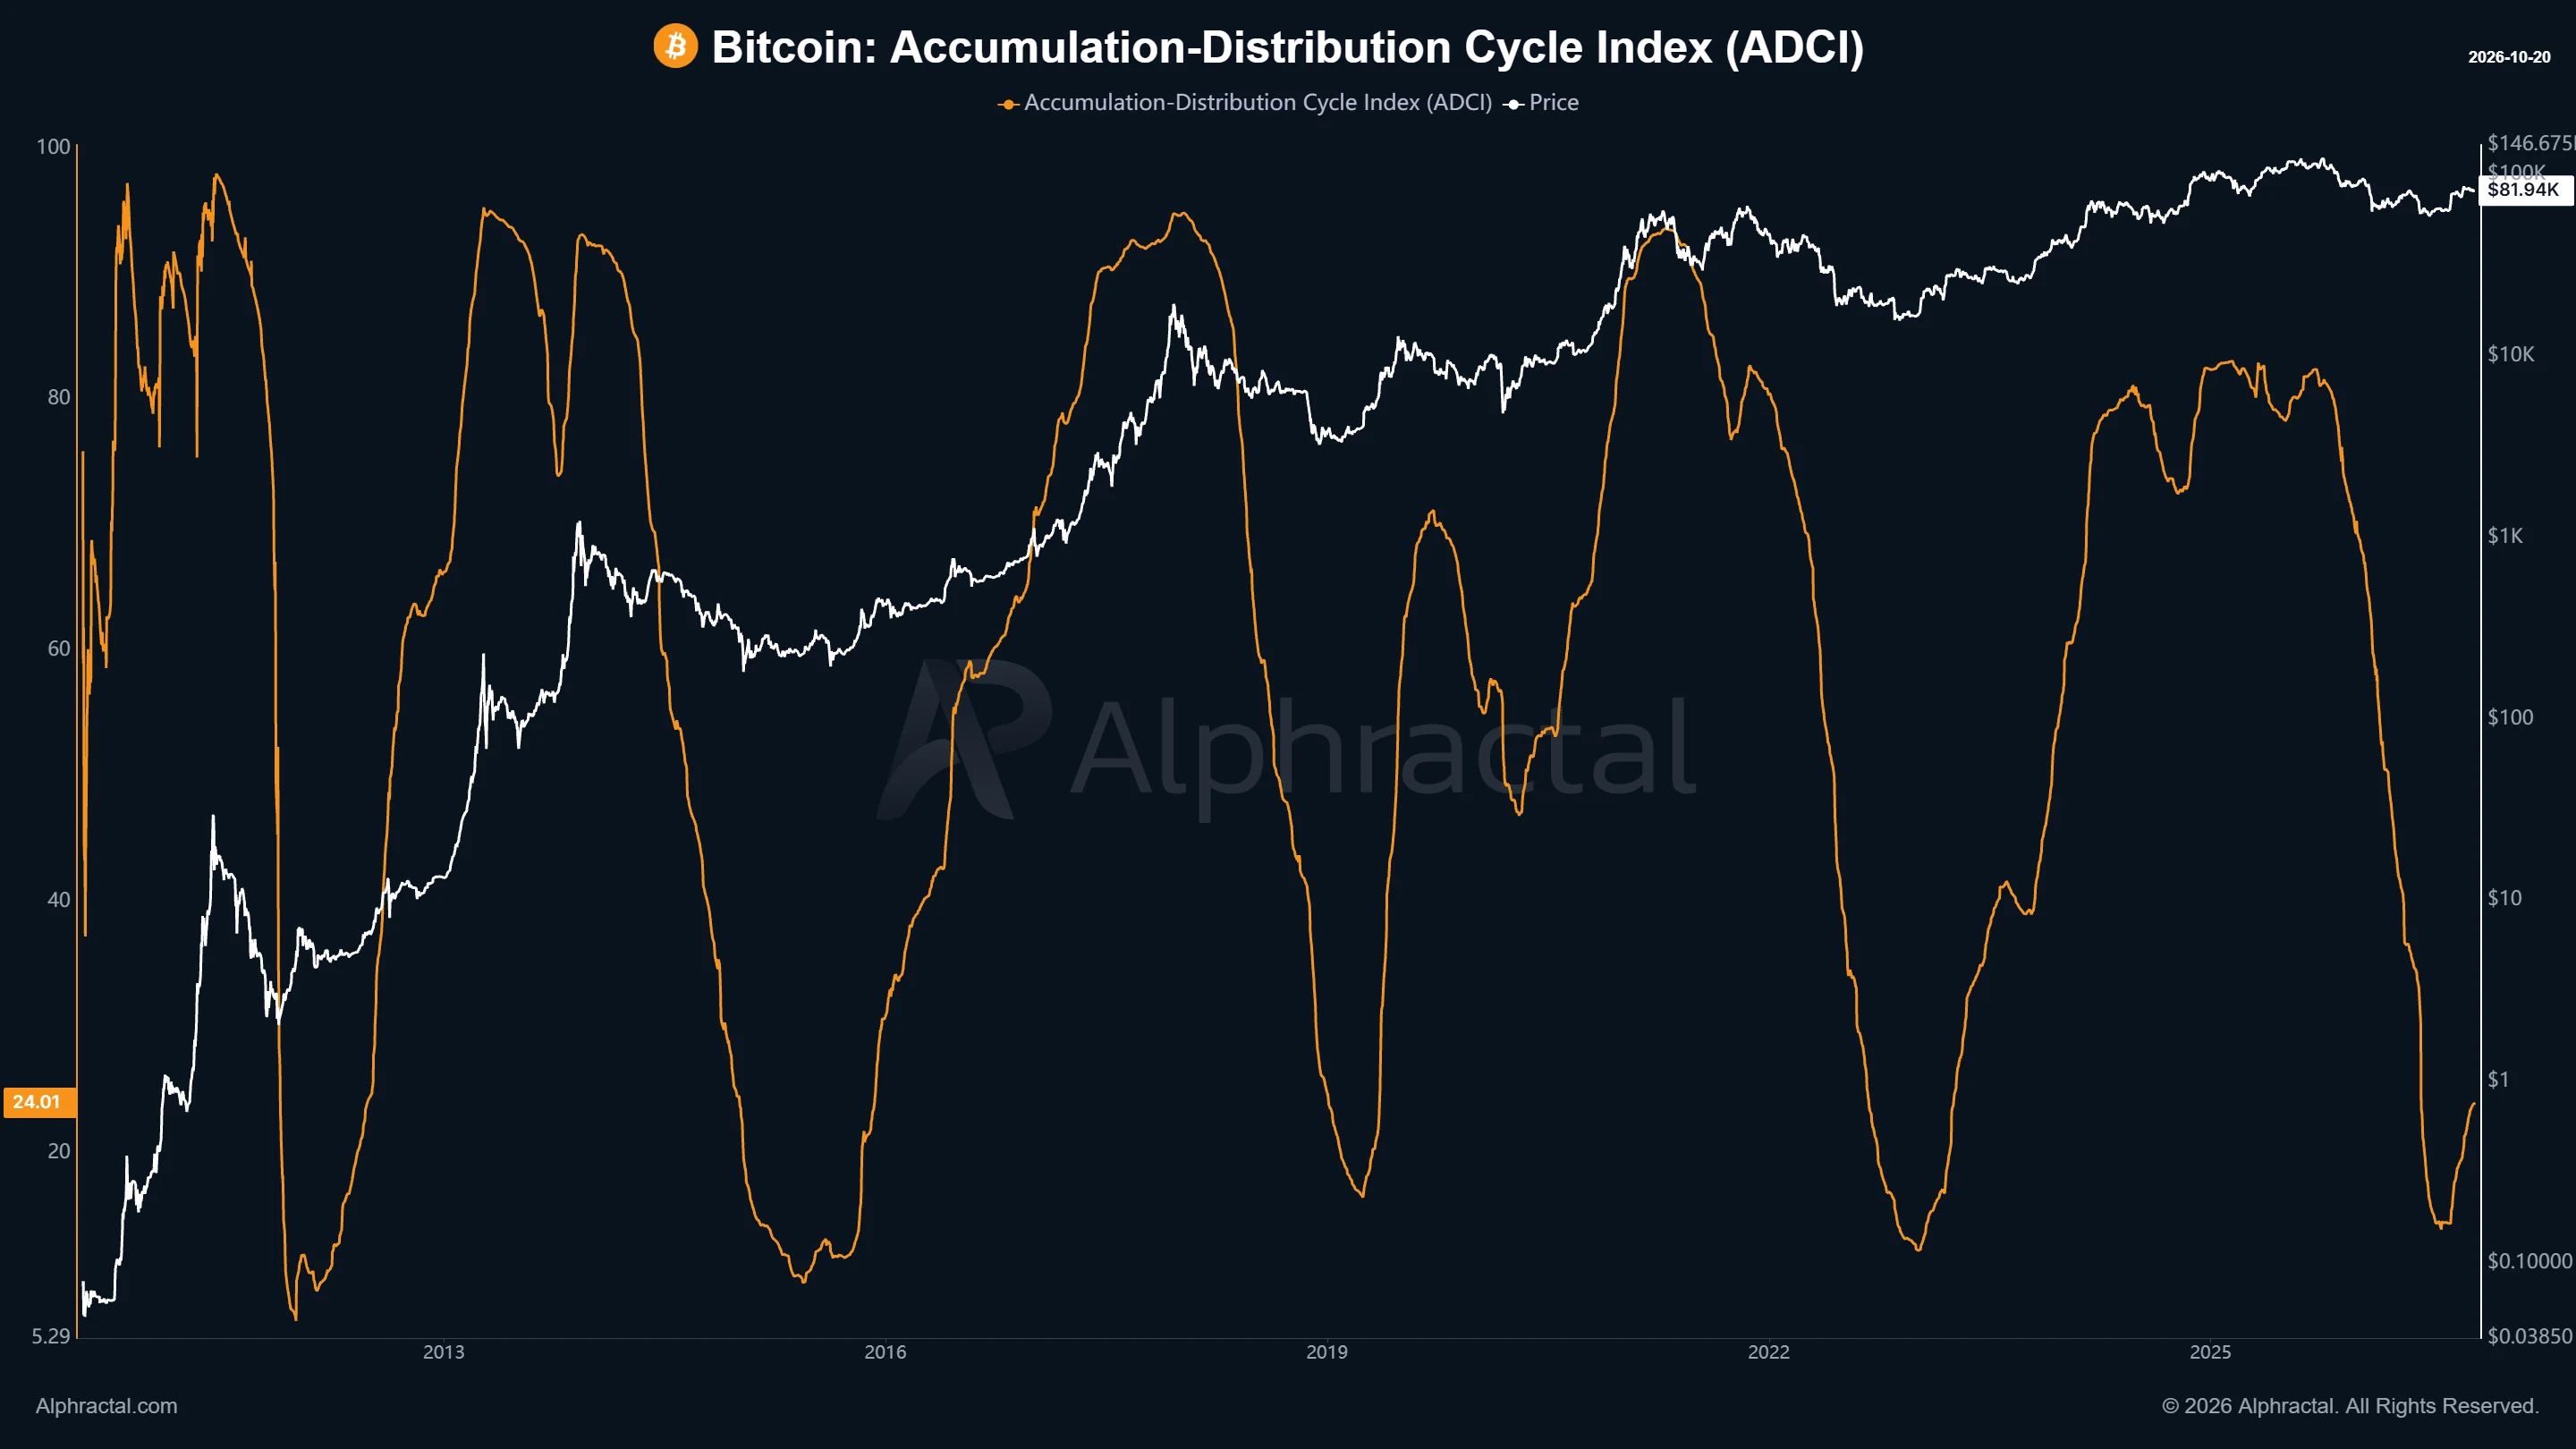
ADCI
A 0–100 index that places Bitcoin market behavior in a longer-term accumulation–distribution framework.
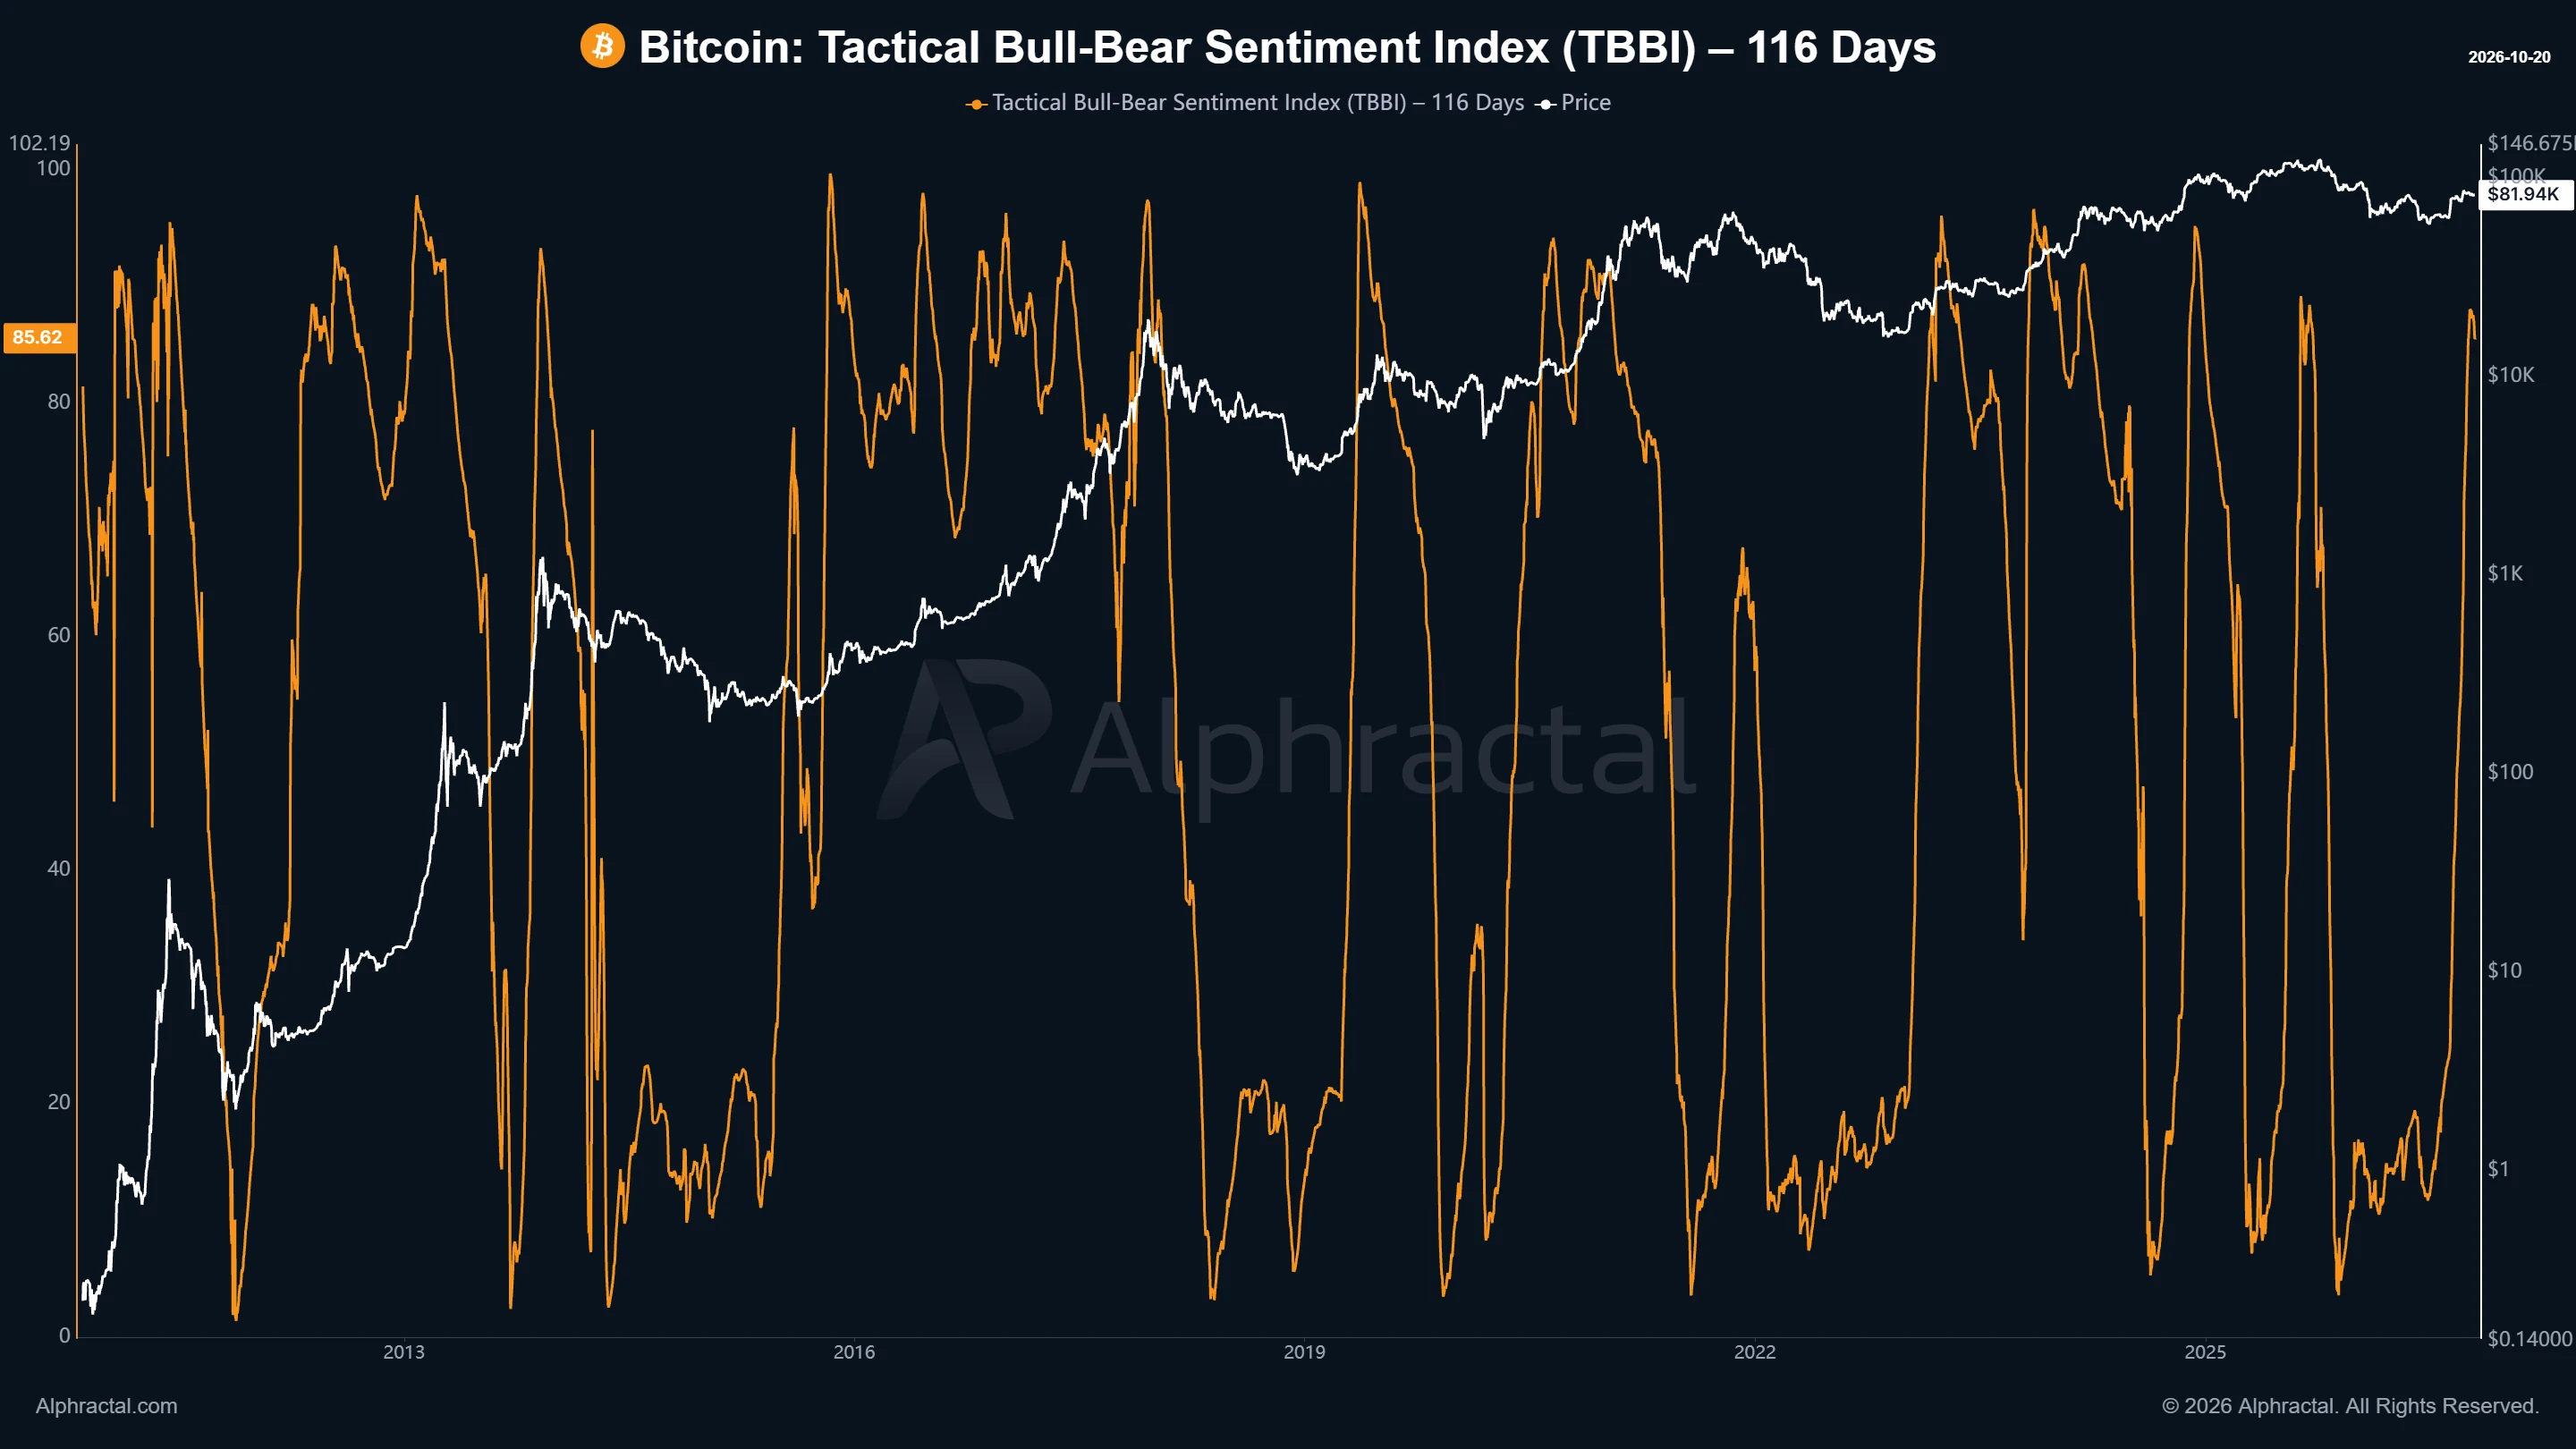
TBBI
A bull–bear sentiment oscillator offered in different lookback windows, including 90 and 116 days.
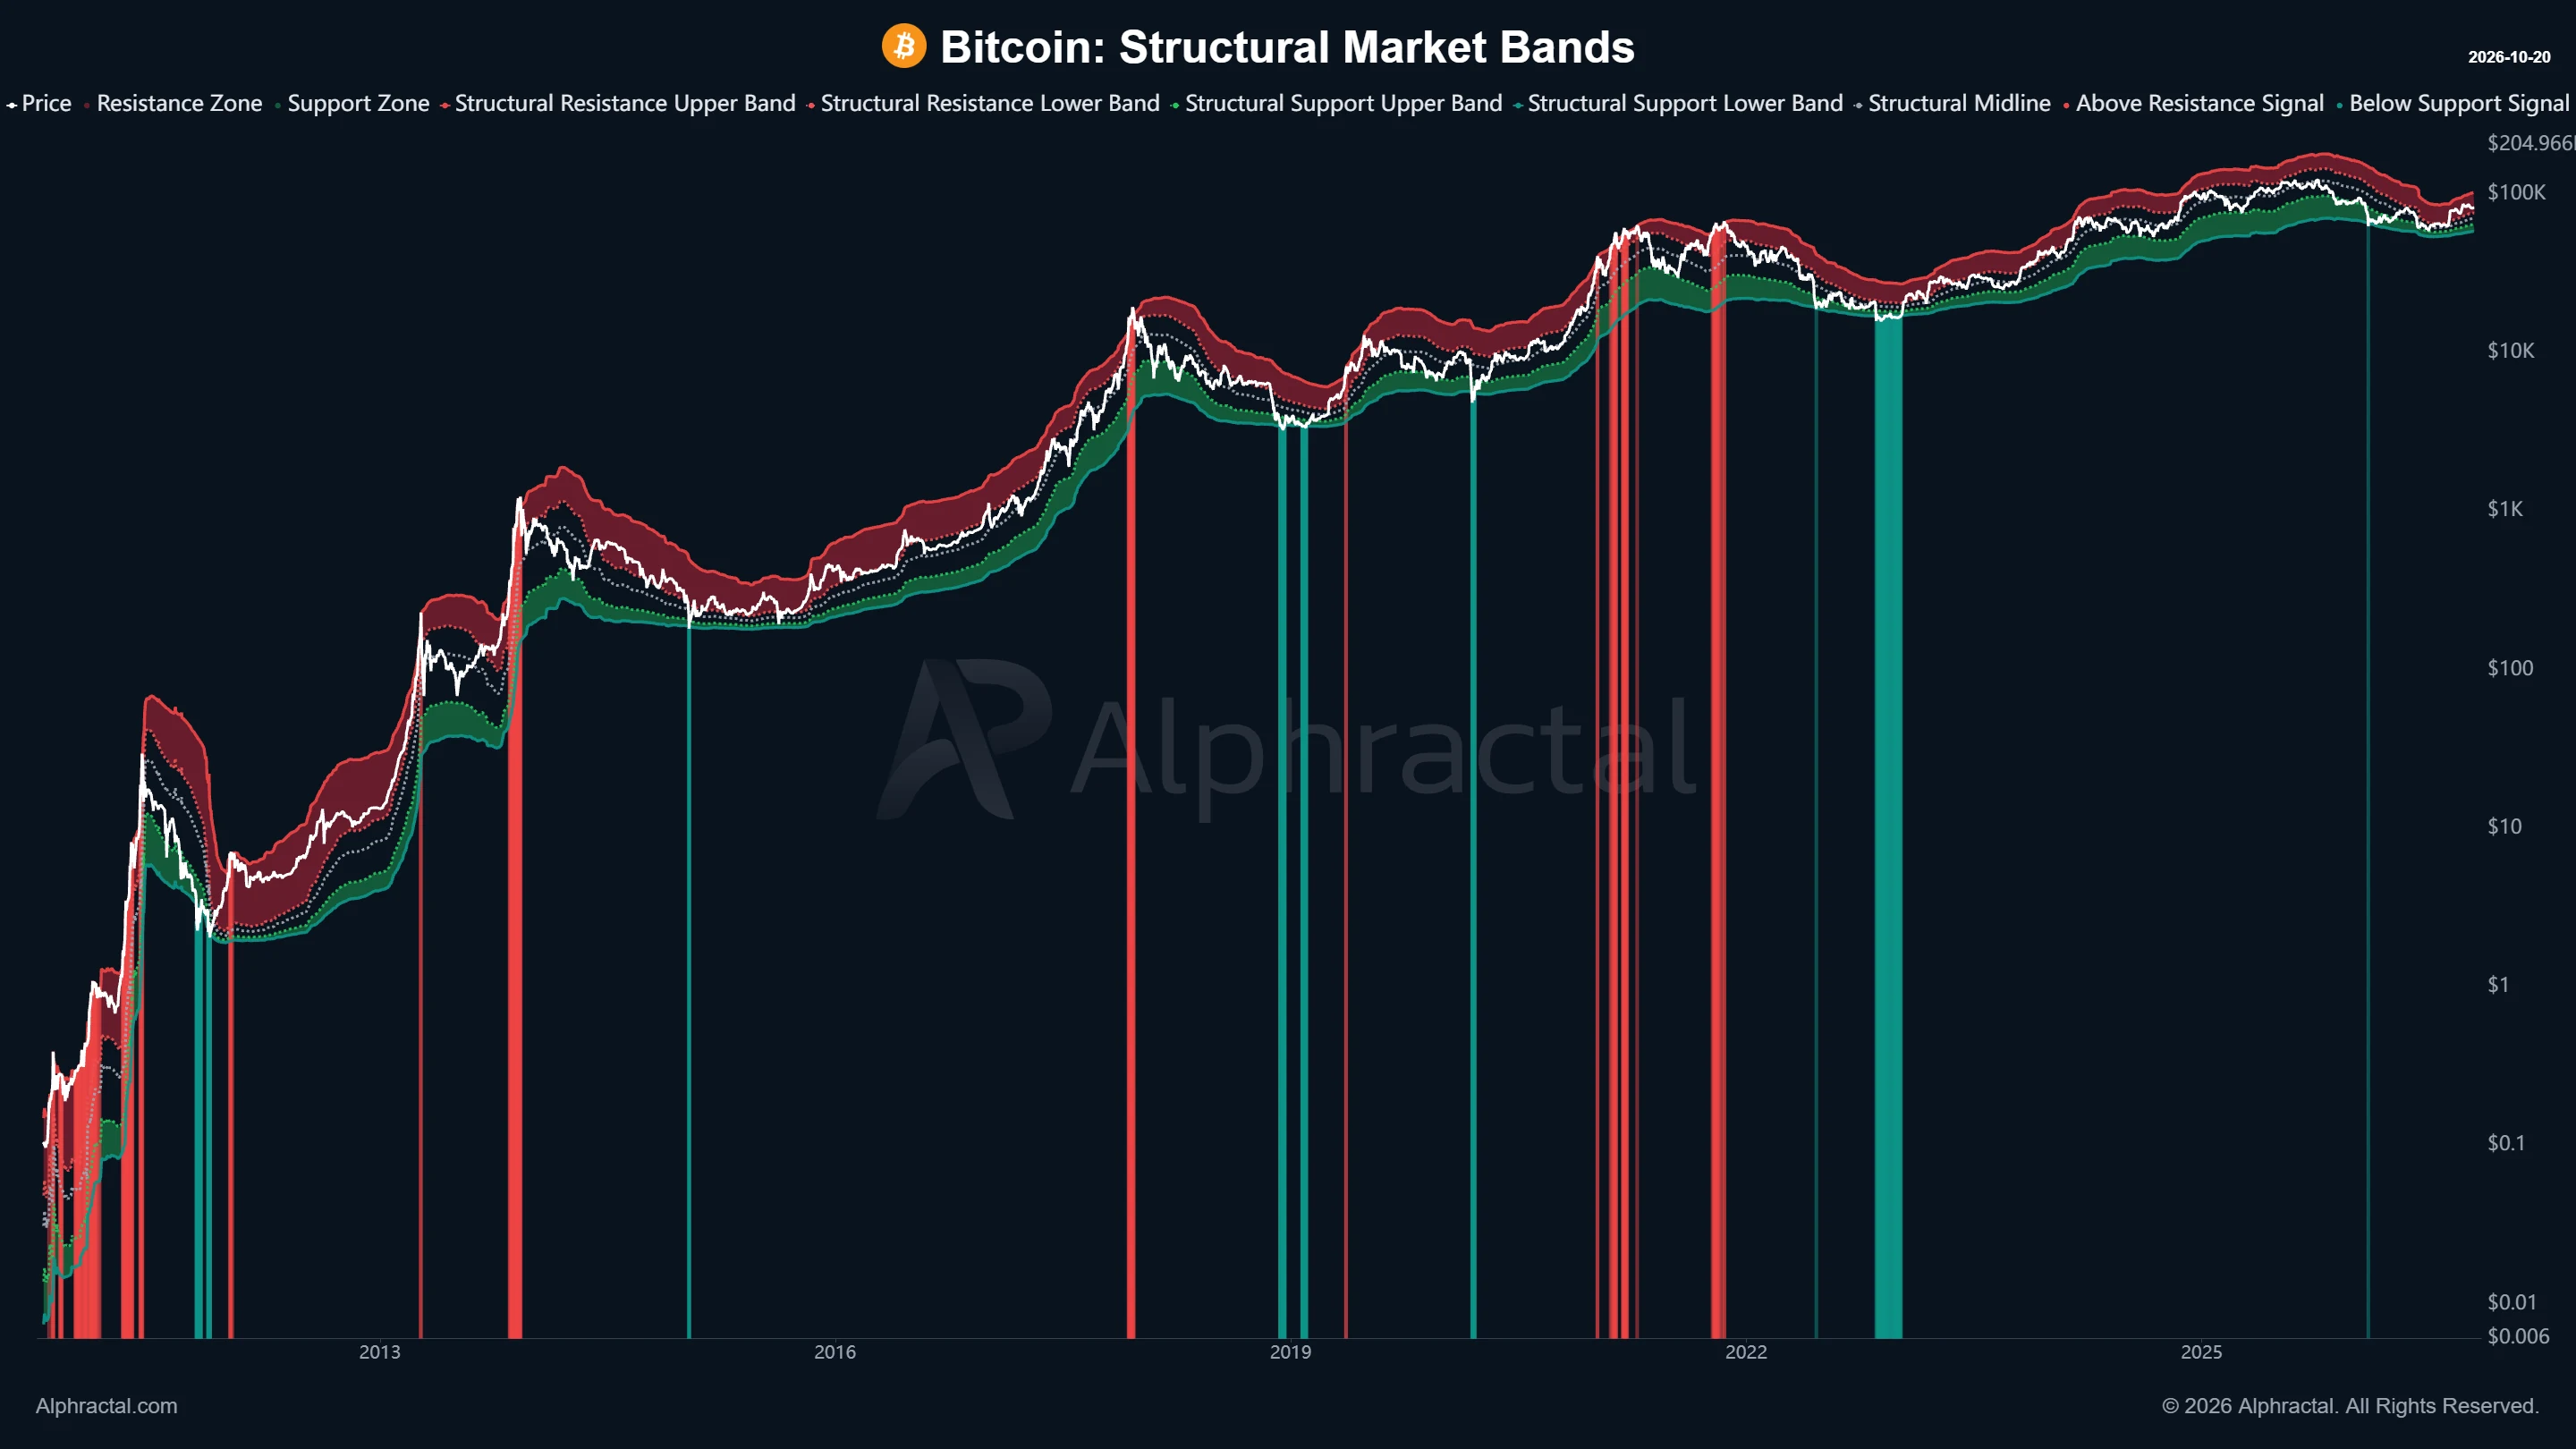
Structural Market Bands
Support and resistance zones derived from on-chain valuation anchors.
Use case Compare the broader cycle backdrop with tactical sentiment and structural price zones.
Sentiment & social activity
Separate market psychology from social attention. Compare composite sentiment gauges with the volume of new posts about an asset.
Crypto Fear and Greed
A composite gauge of cryptocurrency-market sentiment.
Stocks Fear and Greed
A sentiment gauge for equity markets.
Social Interactions Total
The catalog’s measure of new posts created about an asset.
Use case Compare changes in attention with crypto sentiment and the wider risk backdrop.
Macro & liquidity
Bring the monetary and financial backdrop into crypto analysis. Follow liquidity, dollar strength, interest rates and credit conditions alongside market data.
M2 Money Stock
A measure of U.S. money supply, including currency, deposits and other liquid money balances.
U.S. Dollar Index
Dollar strength against a basket of major currencies.
10-Year Treasury Yield
A benchmark for long-term U.S. government borrowing yields.
High-Yield Credit Spread
The additional yield demanded on below-investment-grade U.S. corporate bonds relative to comparable Treasuries.
Use case Compare crypto-market conditions with changes in liquidity, rates and credit risk.
ALPHRACTAL MODELS
From market data to analytical models.
Explore models for valuation, cycle structure and leveraged positioning. Understand what each chart measures and how it fits into a broader market analysis.
ALPHRACTAL MODEL
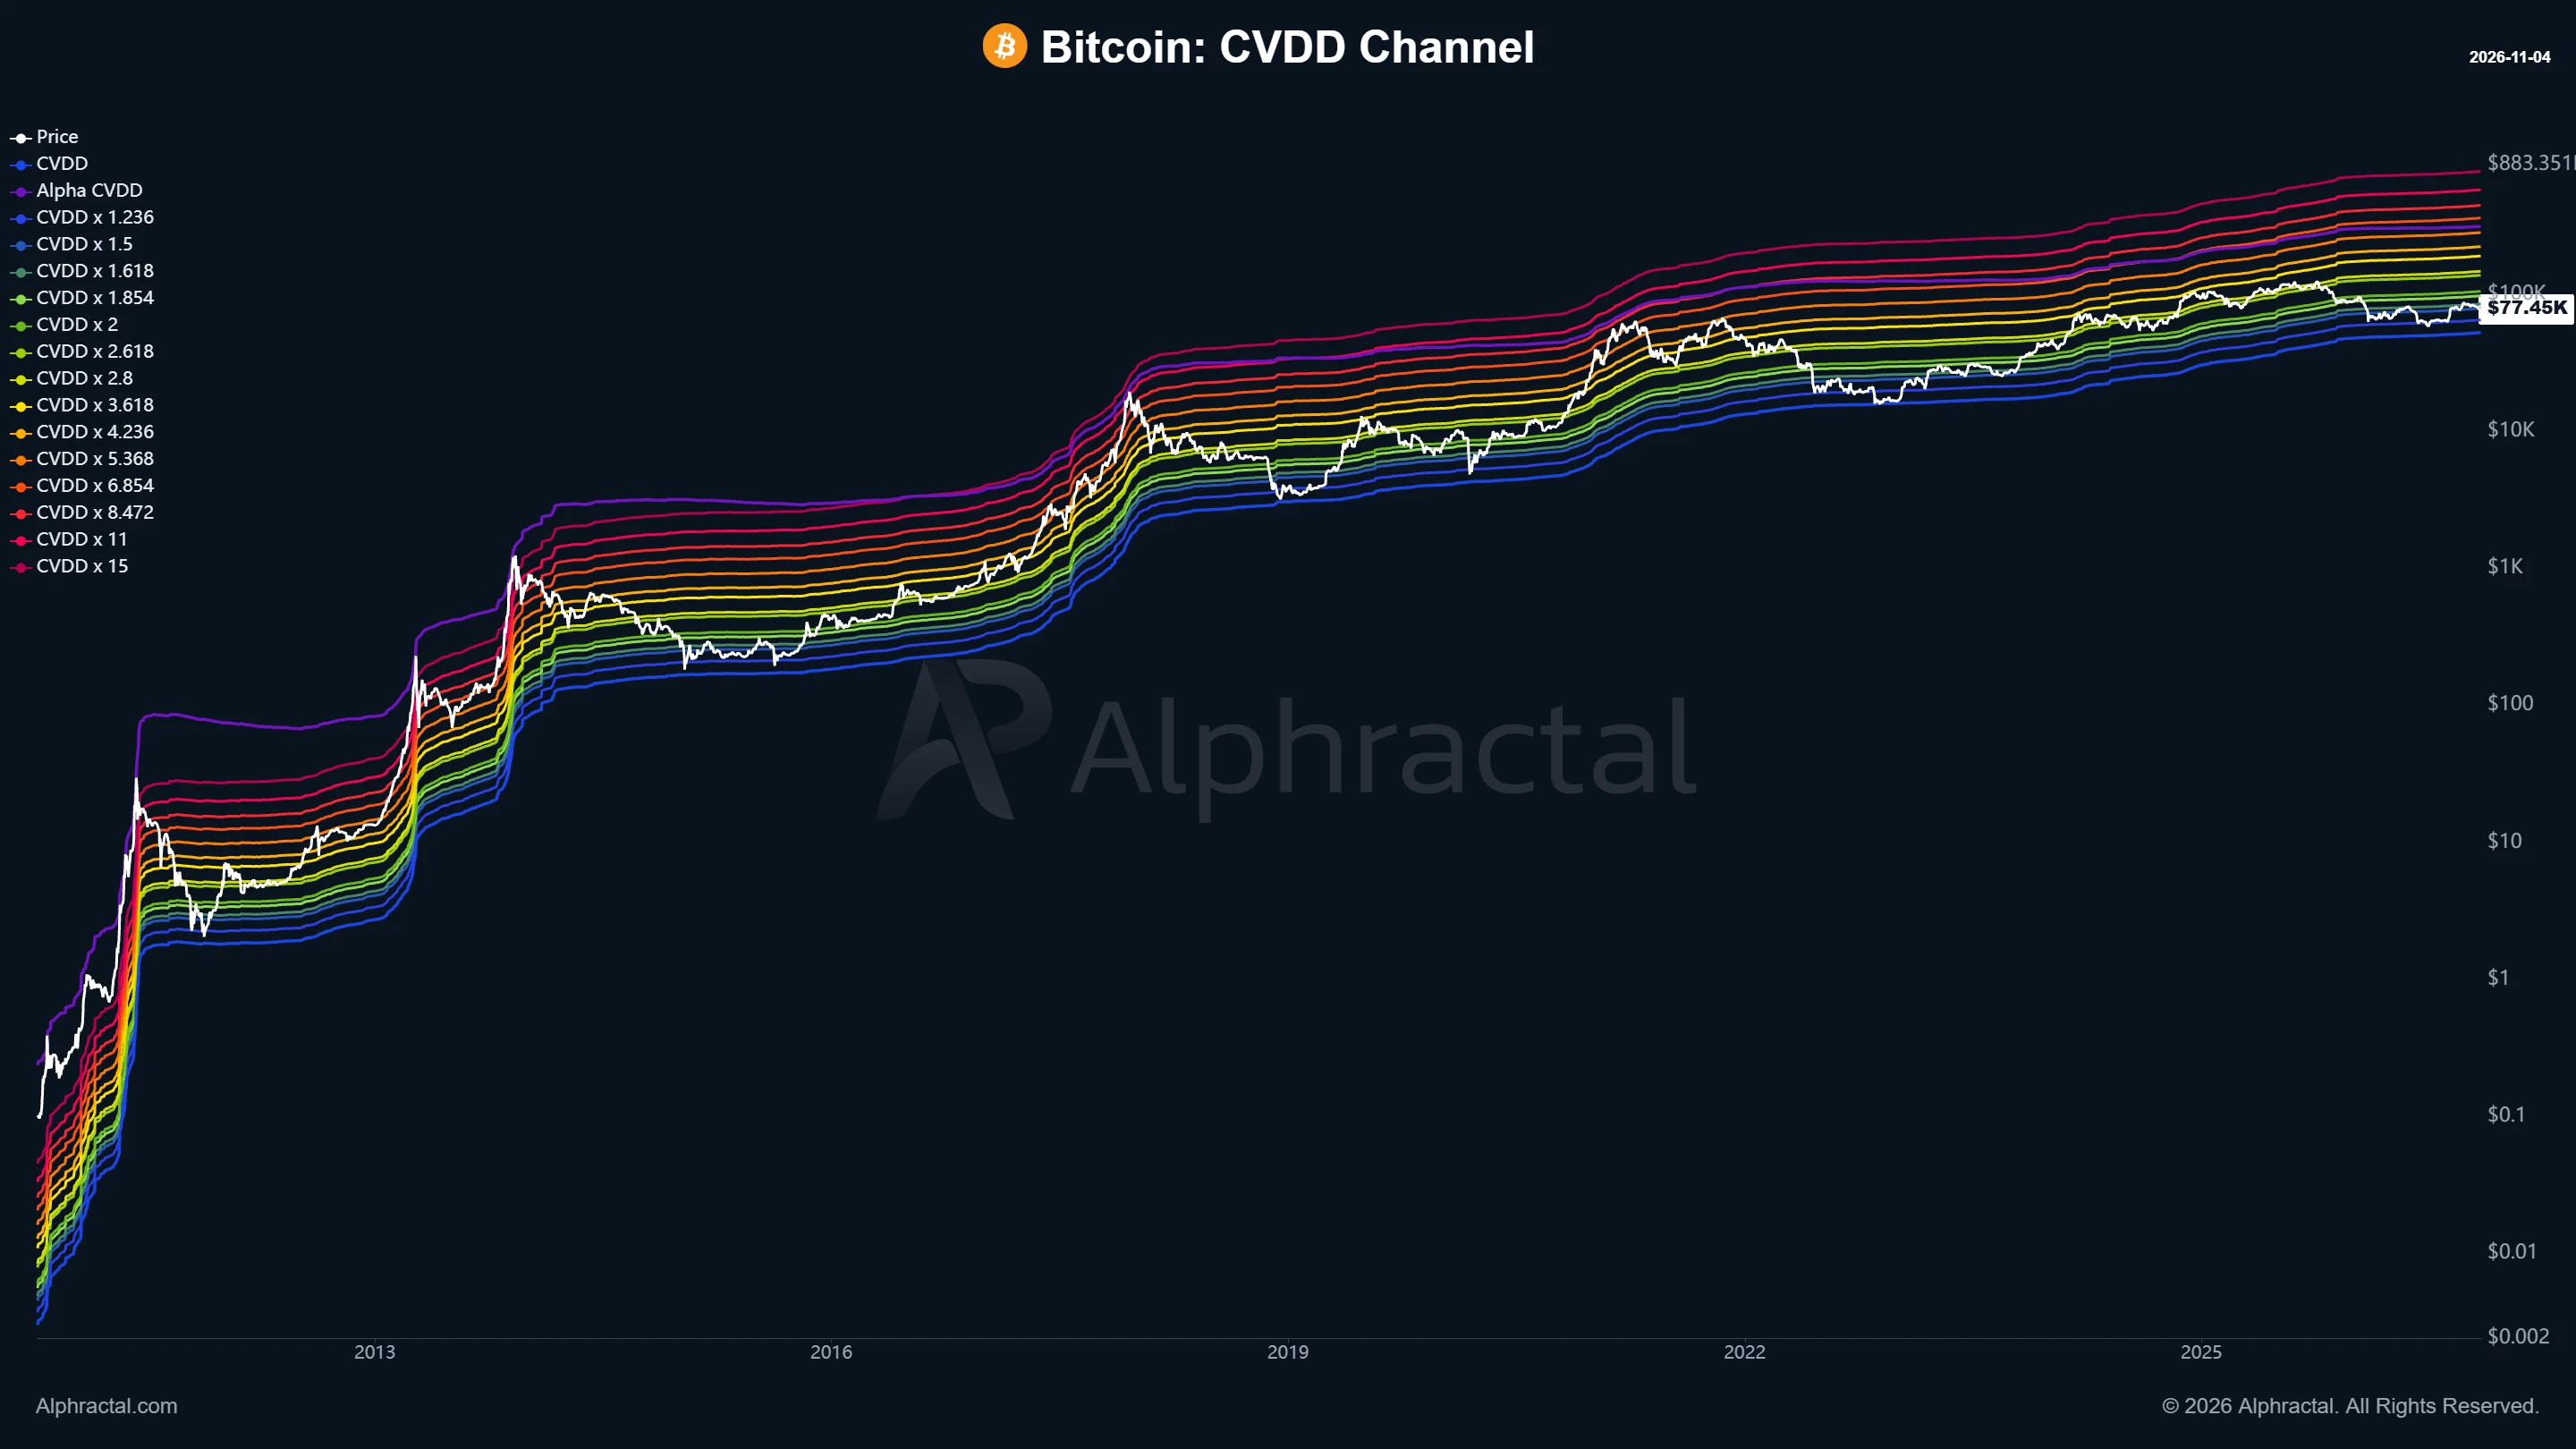
CVDD Channel
Compare price with the original CVDD reference and Alphractal’s CVDD Model 2. The channel brings coin age and destroyed value into a long-term view of valuation and holder behavior.
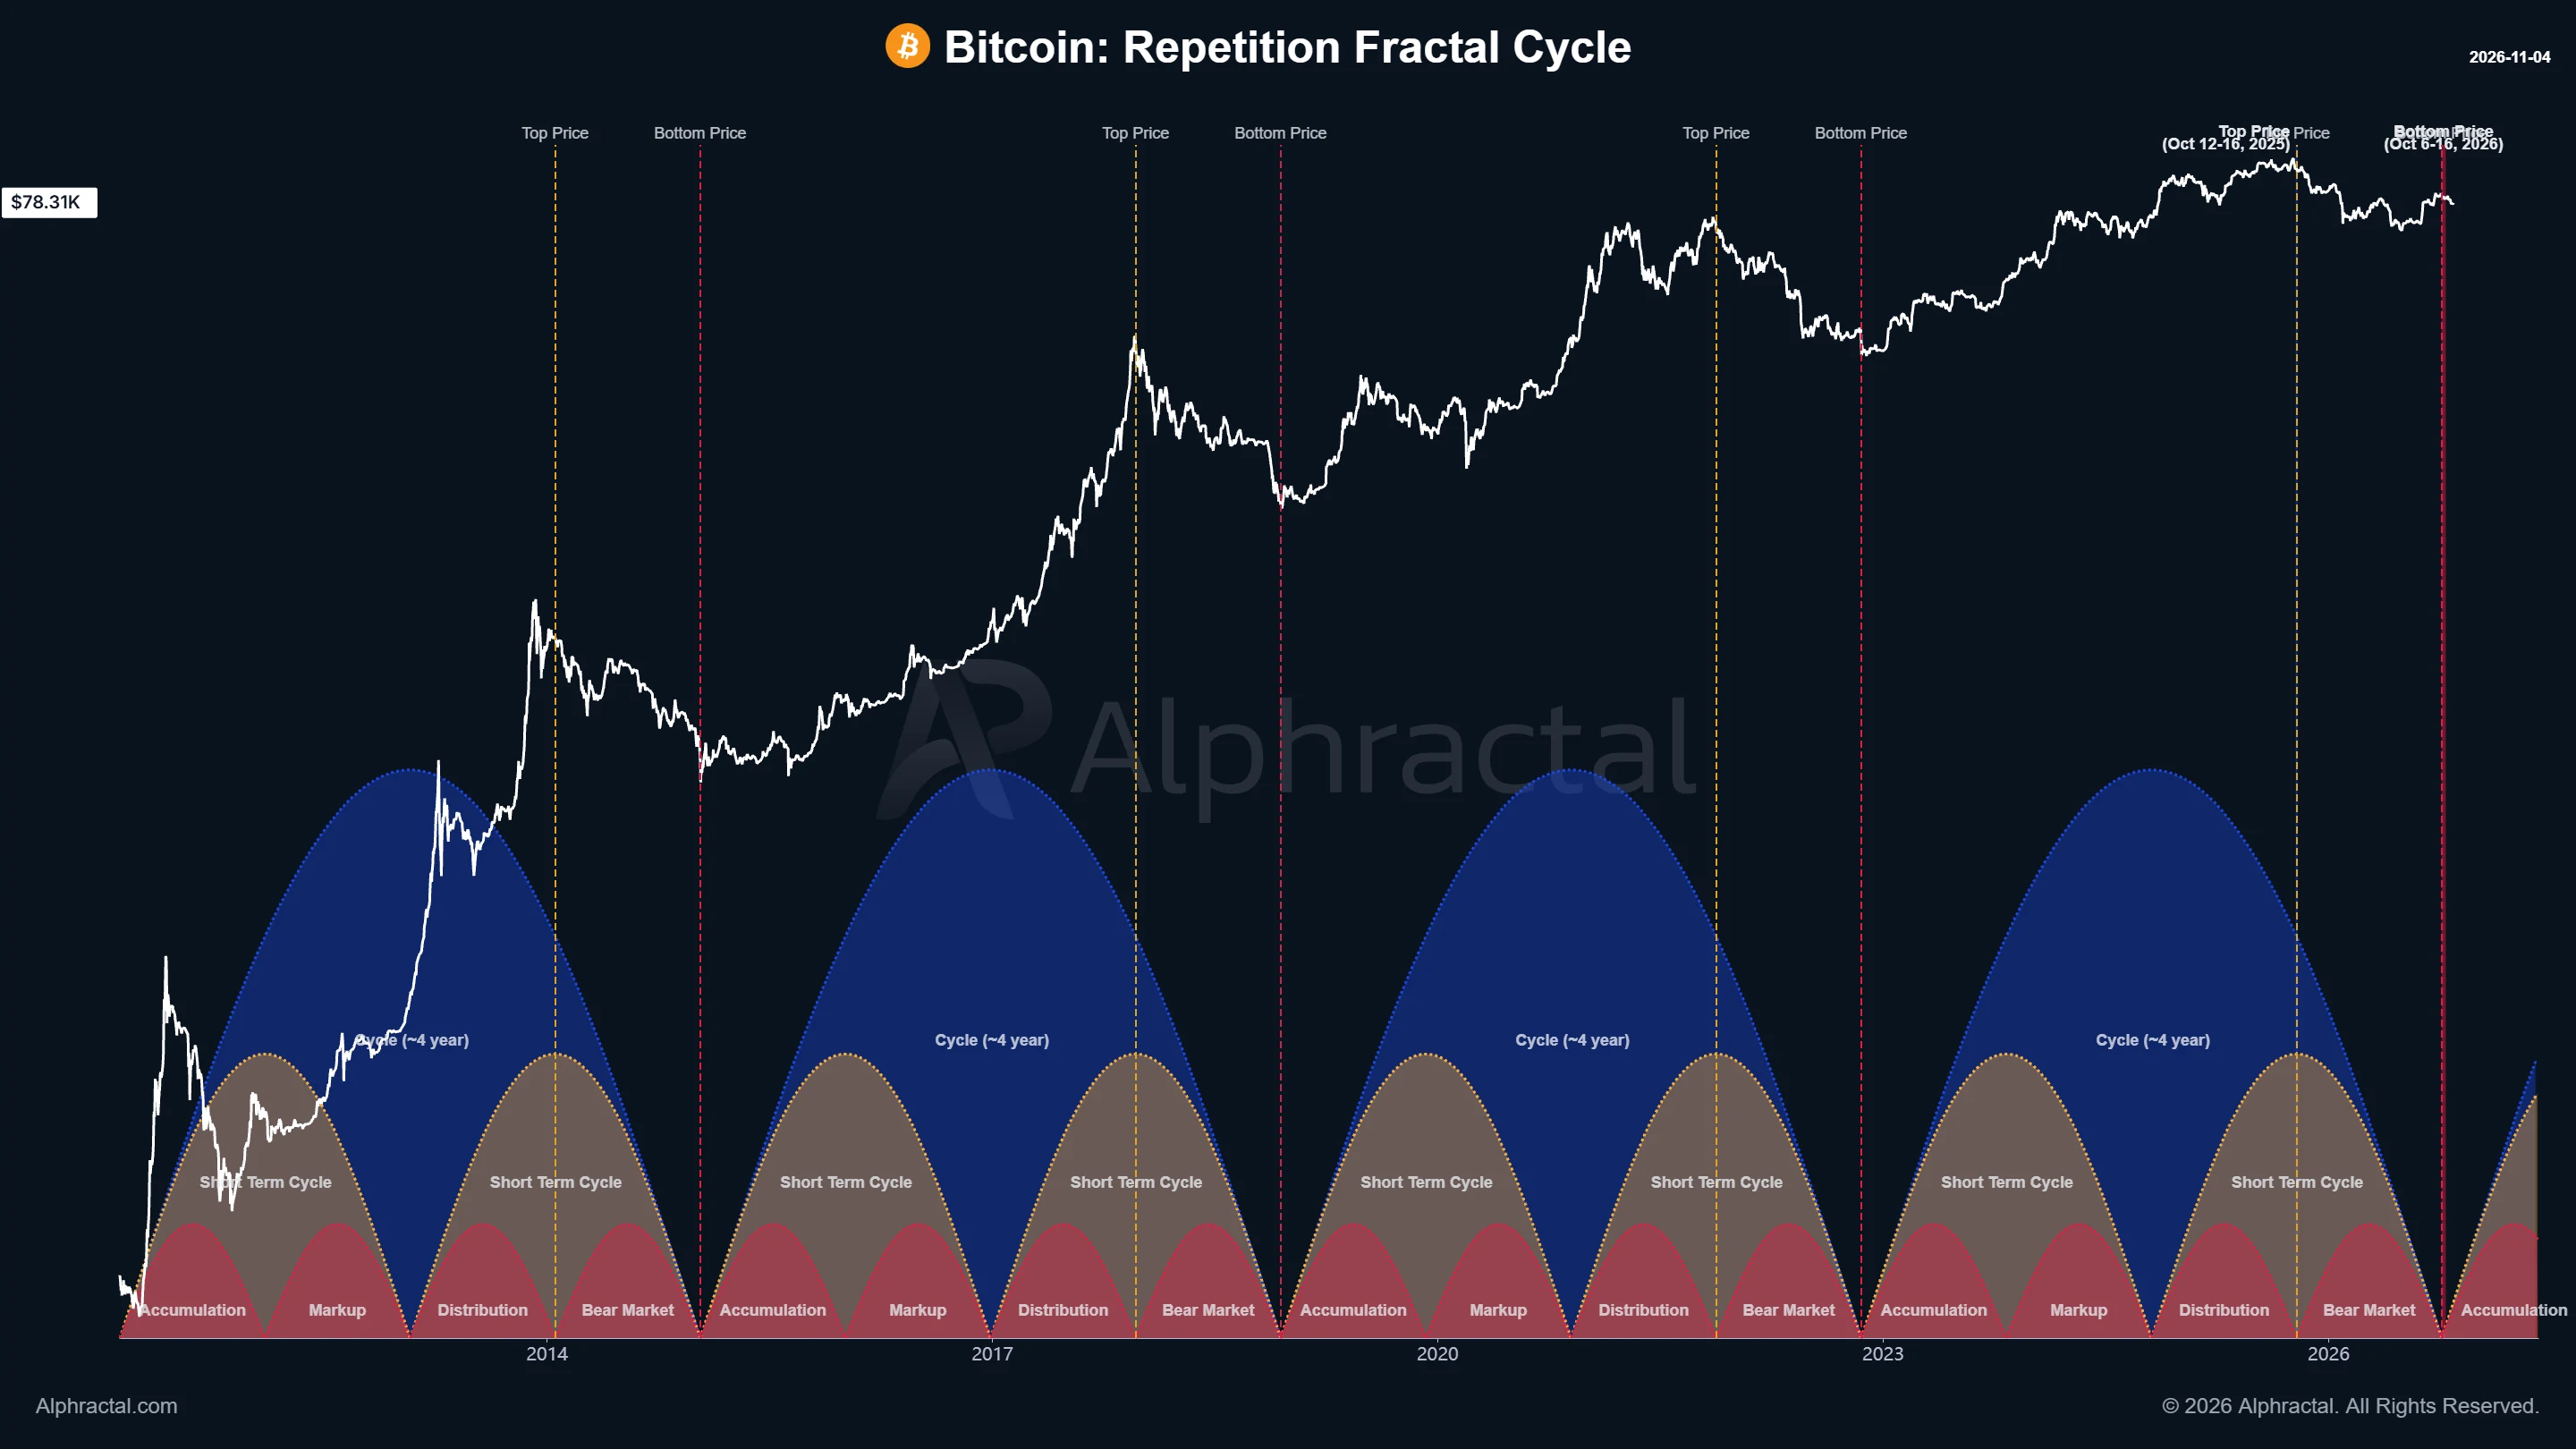
Explore a proprietary timing model built around recurring patterns in Bitcoin’s market cycle. Use the chart to study structural repetition across cycle phases.
Focus: Bitcoin cycle timing and recurring market structure.
Track bull–bear sentiment across different lookback windows. Compare more responsive tactical readings with the slower backdrop of the broader market cycle.
Examples: 90-day and 116-day lookbacks · Scale: 0–100.
Read structural support and resistance as zones interpolated between on-chain valuation anchors. Four bands define graduated support and resistance regions, with calibration informed by active, short-term holder and long-term holder realized prices.
Outputs: upper and lower support bands · upper and lower resistance bands.
Explore estimated concentrations of leveraged positions at risk of liquidation. Heatmaps and zones help you study how liquidation exposure is distributed across price levels.
Views: heatmap · price zones. Levels are statistical estimates, not a complete record of exchange positions.
No. Coverage varies by asset and data family. Check the available metrics for the asset you want to analyze.
Historical depth varies by metric and asset. Access to historical data also depends on your plan.
No. The library combines established indicators with Alphractal-developed models and specialized chart implementations. Proprietary models are identified separately.
Update frequency depends on the metric and its source. A chart’s time interval describes how data points are grouped; it does not mean every source publishes new data at that frequency.
Explore Alphractal Academy for metric definitions and interpretation. For programmatic access, visit our API and MCP pages. Supported data and usage limits depend on the service and your plan.
Start with the free plan.
Explore the platform and find the metrics behind your next question.


 Bitcoin
 Ethereum
 Cardano
 Dogecoin
 Litecoin
 Zcash